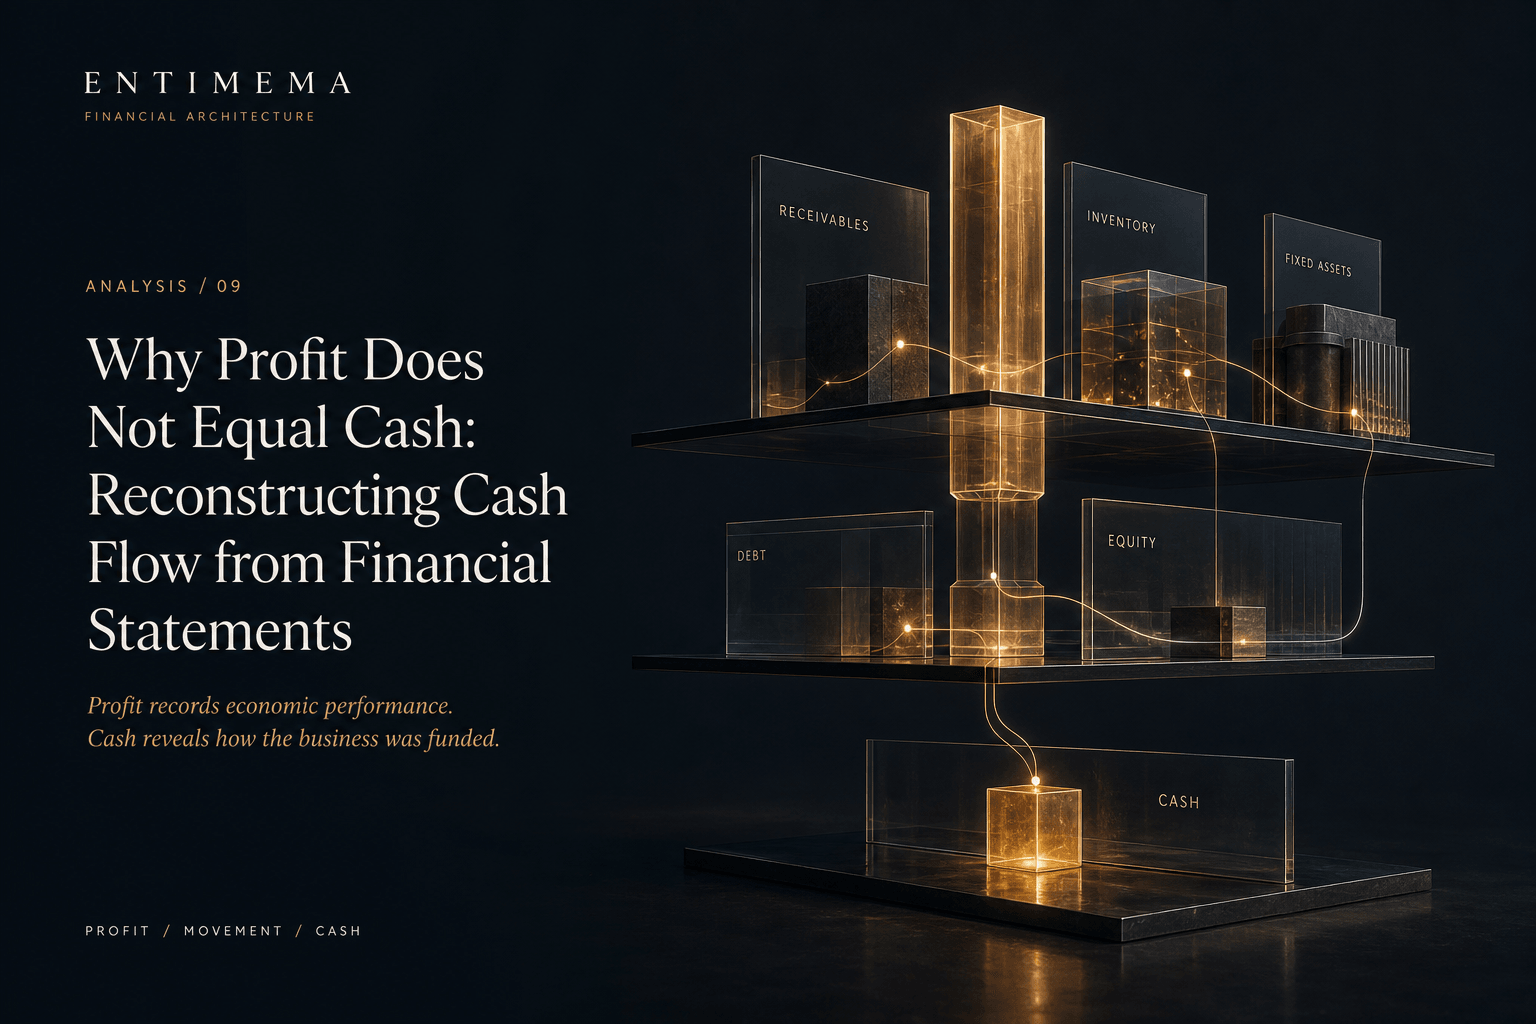
EUR 4.2 million profit after tax. Positive EBITDA. Growing revenue. Yet cash ends the year exactly where it began: EUR 2.5 million. Management asks where the profit went. “Customers paid later”, “we bought stock” and “there was capex” sound reasonable. None demonstrates that the whole movement has been explained.
The fictional company below has no accounting loss and no missing cash. Its financial statements describe different parts of the same economic activity. The P&L recognises performance; the Balance Sheet holds unsettled claims, commitments and investments; the cash-flow statement explains settlement and funding. Reconstructing their connections replaces a plausible narrative with an evidence-based account of liquidity.
One economic event leaves different statement effects
A EUR 1m credit sale increases revenue and receivables when the applicable recognition criteria are met. Profit increases only after associated costs and tax; cash arrives on settlement. A EUR 1m machine bought for cash immediately reduces liquidity and creates an asset. Depreciation allocates its depreciable amount over time rather than charging the purchase to profit in full.
Expenses likewise follow consumption or obligation, not necessarily payment. Provisions and impairments can reduce earnings before any settlement. Borrowing and shareholder funding can increase cash without creating revenue. Accrual accounting does not obscure cash: it records events on a different timing and measurement basis. Reconstruction reconnects those views.
| Economic event | P&L | Balance Sheet | Cash-flow statement |
|---|---|---|---|
| Credit sale | Revenue; profit net of costs | Receivable increases | None until collection |
| Inventory bought on credit | No expense until consumed or sold | Inventory and payable increase | No immediate cash |
| Supplier payment | No repeated expense | Payable and cash decrease | Operating outflow |
| Depreciation | Expense | Net PPE decreases | Non-cash reversal |
| Cash capex | No immediate full expense | PPE rises; cash falls | Investing outflow |
| Borrowing / principal repayment | No operating profit effect | Debt and cash rise / fall | Financing inflow / outflow |
| Dividend declared then paid | No operating expense | Equity to payable, then cash settlement | Financing payment in this example |
| Asset disposal | Gain or loss only | Asset removed; cash or receivable recognised | Full cash proceeds in investing |
Every reconstructed movement should connect to at least two statement effects or a supporting movement schedule. The table is a tracing discipline, not permission to infer settlement from recognition alone. An unpaid asset sale creates a disposal receivable, not investing cash.
Fix the interval before explaining the difference
Record entity and consolidation perimeter, opening and closing dates, reporting currency, units, and whether activity is monthly, quarterly, year to date or annual. Opening balances must agree to the preceding close, or have an explicit restatement bridge. Define cash equivalents, restricted balances, overdraft treatment, acquisition and disposal dates, discontinued operations and currency translation. Record the reporting framework and classification policy for interest and dividends.
Obtain the P&L, both Balance Sheets, trial-balance movements, bank reconciliations, and fixed-asset, debt, equity, tax and interest schedules. Map each source to its period and version. Eliminate intra-group flows within the selected perimeter. For an acquisition, separate acquired balances from subsequent operating movements and reconcile consideration net of cash acquired under the applicable presentation.
Rolling earnings paired with another interval, inconsistent trial-balance extraction cut-offs, missing acquisition dates and unbridged restatements all break the movement analysis. Label the output provisional, identify the missing interval or state, request the correct opening or closing population, and isolate one-off timing. Do not annualise irregular capex or settlement flows to fill the gap. Block unsupported liquidity conclusions even when the residual is zero.
Build one controlled bridge, with one profit basis
- Earnings conversion: select profit basis; reverse non-cash recognition and remove investing or financing P&L effects as required.
- Operating cash: convert operating working capital; reconcile cash tax and interest under the stated classification policy.
- Investment and financing: reconstruct capex and disposals, then debt, equity and dividends; retain separate category subtotals.
- Cash reconciliation: add currency and evidenced other effects; connect net movement to opening and closing cash; investigate the residual.
The principal example starts from profit before tax, EUR 5.2m. Interest remains an operating payment and is already deducted in that profit measure. Profit after tax is shown as the executive entry to the same bridge; adding back tax expense converts it to the principal starting point. These are sequential reconciled bases, not competing calculations.
| Basis | Required discipline |
|---|---|
| Profit after tax | Reverse tax expense, including deferred tax, before deducting reconciled cash tax; or use a fully consistent net-tax bridge. |
| Profit before tax | Deduct cash tax separately; reconcile interest already included rather than deducting it twice. |
| Operating profit | Resolve excluded interest, investment income and other items according to cash-flow classification. |
| EBITDA | Do not add depreciation again. Define impairment, provisions and disposal items; incorporate interest, tax and working capital. |
This is an analytical reconstruction for a 2025 reporting period without early adoption of IFRS 18. It is not a universal statutory format. IAS 7’s IFRS 18 amendments change the indirect-method starting point to operating profit and revise interest and dividend classification. IFRS 18 applies from annual periods beginning 1 January 2027, with early application permitted. Check the adopted requirements before preparing statutory statements.
Reverse recognition without erasing settlement risk
Add back depreciation and amortisation because they reduced profit without current-period payment. Reverse impairment, expected-credit-loss charges, inventory write-downs, deferred tax, share-based compensation and fair-value movements only where they entered the chosen starting measure. Remove disposal gains, or add back losses, because investing records the settlement proceeds rather than the P&L margin.
A provision charge is not permanently irrelevant to liquidity. If opening provision is 0.6, expense 0.4 and closing provision 0.7, payments are 0.3 absent other movements. Add back the 0.4 charge and deduct the 0.3 payment, or use the equivalent net liability adjustment. Never combine both approaches. Reversals, acquisitions and FX require separate columns before deriving settlement.
Allowance movements also change the interpretation of operating assets. A receivable write-off against an existing allowance is not customer collection. If an impairment charge is added back separately, remove its effect from the net receivable movement before calculating working-capital cash. Otherwise the same non-cash reduction is reversed twice. Apply that discipline to stock write-downs and subsequent disposals.
Separate unrealised exchange effects in profit from realised settlement and translation of cash balances. The first may need reversal, the second belongs with the underlying transaction, and the third explains a reporting-currency change outside operating, investing and financing flows. Financing fees and lease interest need their own accrual and cash classifications, not a blanket “non-cash” label.
Convert operating balances into cash direction
OWC = Operating current assets − Operating current liabilities
| Movement | Cash consequence |
|---|---|
| Receivables increase / decrease | Use / source |
| Inventory increases / decreases | Use / source |
| Operating payables increase / decrease | Source / use |
| Prepayments increase | Use |
| Operating accruals increase | Source |
The sign follows the economic relationship. More receivables mean recognised sales remain uncollected; more supplier liabilities mean recognised purchases remain unpaid. Buying stock on credit increases both inventory and payables, so the immediate net cash effect is zero. An increase in an asset is not automatically an outflow if it arose through acquisition, translation or another non-cash event.
Exclude cash, debt and capital creditors from ordinary operating working capital. Keep tax and interest accounts in separate bridges under a documented policy. Include indirect taxes, contract assets and customer advances where relevant, with their own evidence. Reconcile gross balances, allowances, write-offs and reclassifications before using net differences. A closing balance alone cannot establish the cash movement.
FIR-08’s working-capital analysis tests collection, stock quality, supplier terms and operating drivers. Here the task is narrower: quantify the portion of recognised activity that has not become cash, then hand the verified movement to that operational diagnosis. Cash absorption is a fact to establish before deciding whether growth, deterioration or deliberate resilience caused it.
Separate tax and interest recognition from payment
+ Opening tax payable − Closing tax payable
Tax expense can contain current and deferred tax. A deferred charge does not belong in current-tax payable. Extend the bridge for receivables, payments on account, prior-period settlements, acquired balances, FX, reclassifications and tax recognised outside profit. Starting from profit after tax requires reversing the relevant tax recognition before deducting payment; starting before tax does not.
+ Capitalised interest incurred + Opening interest payable
− Closing interest payable − Non-cash financing charges
± Evidenced other movements
Capitalised interest is added when deriving total interest incurred from P&L expense, not subtracted: it was never in that expense. If the input already represents total borrowing costs, do not add it again. Reconcile fee amortisation, discount unwinding, FX, acquired accruals and amounts capitalised without payment. Allocate the resulting payment once under the applicable framework and policy; keep the asset-addition bridge consistent with that allocation.
The example has no deferred tax, capitalised interest or financing fees. Current tax expense 1.0 plus opening payable 0.4 less closing payable 0.6 gives tax paid 0.8. Interest expense 0.4 plus opening accrual 0.1 less closing accrual 0.1 gives interest paid 0.4. It already reduced profit before tax, so no second deduction is needed. A financing classification would instead add it back in operating and deduct it in financing, leaving total cash unchanged.
Net PPE movement is not cash capex
− Disposal carrying value − Depreciation − Impairment
± FX, revaluation and reclassification
Solve for additions only after identifying every other movement. Then separate lease additions, capitalised borrowing costs and other non-cash acquisitions. Convert cash-eligible additions to payments using capital-creditor and capital-advance movements. A supplier invoice capitalised in December but paid in January belongs to December additions and January cash. Gross-cost and accumulated-depreciation schedules must reconcile separately before deriving net carrying value.
Disposal proceeds equal carrying value plus gain, or less loss, only before settlement differences. Inspect deferred consideration, disposal receivables, transaction costs and non-cash exchanges. Remove the gain from operating profit reconciliation and show the full cash proceeds in investing. Business acquisitions need their own consideration and acquired-cash reconciliation rather than being hidden in organic capex.
In the example, PPE closes at 12.1 from opening 10.0 + cash additions 3.8 − disposed carrying value 0.3 − depreciation 1.4. The separate 0.3 impairment concerns an indefinite-lived intangible, not PPE. Disposal proceeds are 0.3 + gain 0.2 = 0.5, fully collected. With no capital creditors, leases or other additions, investing cash is −3.8 + 0.5 = −3.3. Without those schedule confirmations, derived cash capex would remain an estimate.
Funding needs transaction evidence, not endpoint subtraction
+ Non-cash additions ± FX and other movements
New leases, acquired debt, accrued or rolled-up interest, fair-value adjustments and translation can change debt without cash borrowing. Moving a loan from non-current to current changes maturity presentation, not total debt or liquidity. Separate lease principal from interest and non-cash inception. A facility can contain both drawings and repayments even when its closing balance is unchanged; preserve gross flows.
− Dividends declared ± OCI and other equity movements
Dividends paid = Declared dividends + Opening dividend payable
− Closing dividend payable ± Other movements
Profit increases equity without guaranteeing cash. Cash capital contributions increase equity without creating revenue; shares issued for an acquisition may not move cash. Dividends reduce equity on recognition, while payment settles cash or a dividend liability. Reconcile declaration and payment dates, issue costs, treasury-share transactions and non-cash contributions before classifying shareholder flows.
The example’s debt moves from 6.0 to 6.8 through drawings 2.0 and repayments 1.2, with no non-cash changes. Dividends of 1.0 are declared and paid in the year, with no opening or closing payable. There are no capital contributions. Financing cash is 2.0 − 1.2 − 1.0 = −0.2. The borrowing increase alone would conceal both the repayment burden and the distribution.
Start with a complete, fictional statement set
All amounts are synthetic EUR millions for 1 January–31 December 2025, with opening balances at 31 December 2024. The same consolidated perimeter applies throughout. There are no acquisitions, discontinued operations, restatements, indirect taxes, leases or restricted cash. One foreign operation holds only cash; its 0.1 translation increase enters OCI. All other balances and flows have no FX effects. These simplifications are assumptions, not inferred facts.
| EUR m | Current year |
|---|---|
| Revenue | 40.0 |
| Operating costs before items below | −32.9 |
| Adjusted EBITDA | 7.1 |
| Depreciation | −1.4 |
| Intangible impairment | −0.3 |
| Disposal gain | 0.2 |
| Operating profit | 5.6 |
| Interest expense | −0.4 |
| Profit before tax | 5.2 |
| Current tax expense | −1.0 |
| Profit after tax | 4.2 |
| EUR m | Opening | Closing |
|---|---|---|
| Cash and cash equivalents | 2.5 | 2.5 |
| Trade receivables | 5.0 | 7.1 |
| Inventory | 4.0 | 5.4 |
| Prepayments | 0.3 | 0.5 |
| Net PPE | 10.0 | 12.1 |
| Indefinite-lived intangible | 1.0 | 0.7 |
| Total assets | 22.8 | 28.3 |
| Trade payables | 3.0 | 3.9 |
| Operating accruals | 0.5 | 0.8 |
| Current tax payable | 0.4 | 0.6 |
| Interest payable | 0.1 | 0.1 |
| Debt | 6.0 | 6.8 |
| Total liabilities | 10.0 | 12.2 |
| Equity | 12.8 | 16.1 |
| Liabilities and equity | 22.8 | 28.3 |
Receivables, inventory, prepayments, payables and operating accruals contain no non-cash movements in this example. OWC rises from 5.8 to 8.3, absorbing 2.5. Receivables and inventory together absorb 3.5; prepayments absorb another 0.2, partly offset by 1.2 supplier and accrual funding. Prior revenue was 36.0 and comparable operating costs 29.6, providing growth context without changing the reconstruction interval.
Bank reconciliation supports domestic cash and equivalents of 1.8 opening and 1.7 closing, plus foreign-operation cash translated at 0.7 and 0.8. There are no outstanding reconciliation items. Transfers between included cash accounts are eliminated; they do not create inflows or outflows. Domestic cash movement is −0.1 and foreign-cash translation +0.1, independently supporting the unchanged 2.5 total.
Follow every adjustment from profit to unchanged cash
| Step | Adjustment | Running total |
|---|---|---|
| Profit after tax | 4.2 | 4.2 |
| Reverse current tax expense | 1.0 | 5.2 |
| Add depreciation | 1.4 | 6.6 |
| Add intangible impairment | 0.3 | 6.9 |
| Remove disposal gain | −0.2 | 6.7 |
| Receivables increase | −2.1 | 4.6 |
| Inventory increase | −1.4 | 3.2 |
| Prepayments increase | −0.2 | 3.0 |
| Payables increase | 0.9 | 3.9 |
| Operating accruals increase | 0.3 | 4.2 |
| Pay current tax | −0.8 | 3.4 |
| Cash capex | −3.8 | −0.4 |
| Disposal proceeds | 0.5 | 0.1 |
| Cash borrowing | 2.0 | 2.1 |
| Principal repayment | −1.2 | 0.9 |
| Dividends paid | −1.0 | −0.1 |
| FX translation of cash | 0.1 | 0.0 |
The 5.2 running total is profit before tax. Subsequent operating adjustments produce 4.2 before cash tax, with interest already included. That intermediate 4.2 happens to equal profit after tax; the equality is coincidental. It is not evidence that profit converted fully into cash. After cash tax, the operating result is 3.4.
| EUR m | Amount |
|---|---|
| Operating cash | 3.4 |
| Investing cash | −3.3 |
| Financing cash | −0.2 |
| Movement before currency translation | −0.1 |
| FX effect on cash | 0.1 |
| Net cash movement | 0.0 |
| Opening cash | 2.5 |
| Reconstructed closing cash | 2.5 |
| Reported closing cash | 2.5 |
| Unexplained residual | 0.0 |
Operating cash is 80.95% of profit after tax under this stated classification. That ratio is descriptive, not a universal quality threshold. Net investment consumes almost all operating cash; borrowing partly offsets repayments and distributions. Positive profit therefore coexists with no cash accumulation. The FX line explains translation, not an additional receipt or improved trading performance.
Prove the components before trusting the total
| Control | Example result | Required evidence |
|---|---|---|
| Opening / closing Balance Sheet | 22.8 = 10.0 + 12.8; 28.3 = 12.2 + 16.1 | Complete mapped trial balances |
| PPE and impairment | 10.0 + 3.8 − 0.3 − 1.4 = 12.1; intangible 1.0 − 0.3 = 0.7 | Asset register and settlement records |
| Debt | 6.0 + 2.0 − 1.2 = 6.8 | Gross drawings and principal payments |
| Equity | 12.8 + 4.2 − 1.0 + OCI 0.1 = 16.1 | Profit, declarations and translation reserve |
| Cash movement | 2.5 + 3.4 − 3.3 − 0.2 + 0.1 = 2.5 | Reconciled cash-equivalent population |
| Unexplained residual | Reported 2.5 − reconstructed 2.5 = 0.0 | All categories and FX accounted for |
Set tolerances in the source currency and precision, not from rounded display values. Reconcile each schedule and the full population, retain source locations, and test that each material transaction appears once. A zero aggregate residual can conceal offsetting errors between operating and investing or omitted gross borrowing and repayment.
Use an independent cash view to challenge the indirect model. Where transaction data is available, aggregate customer receipts, supplier and employee payments, tax, interest, investment and financing settlements from reconciled accounts. Match that population to the ledger without including internal transfers twice. Differences between direct settlement totals and the indirect reconstruction identify where recognition, classification or cut-off needs investigation; agreement is stronger evidence than either view alone.
Preserve a movement record containing opening value, additions or charges, cash settlement, non-cash adjustment, acquisition or disposal, currency effect, reclassification and closing value. Attach source references and approval state to each material column. The schedule then explains why a balance changed, rather than using its unexplained change as evidence that cash moved. Version changes should rerun dependent subtotals and invalidate any previously approved conclusion affected by the correction.
If closing cash were 2.6 with the same supporting flows, the unexplained residual would be 0.1. Investigate cut-off, missing accounts, settlement status, translation, restrictions and classification before accepting the result. Do not force it into “Other”. An evidenced other effect needs its own definition, source, owner and treatment; a residual remains an exception until resolved.
Restricted cash requires a separate availability view even where it belongs to the reported cash population. A transfer between unrestricted and restricted accounts may change accessible liquidity without changing total cash. Reconcile the reporting perimeter first, then bridge availability for the management decision. Neither reconciliation substitutes for a forward cash forecast or covenant assessment.
Move from reconciled amounts to owned decisions
- Scope: align entity, currency, period and cash definitions.
- Profit basis: identify the bridge starting measure.
- Non-cash recognition: isolate earnings effects without payment.
- Operating timing: locate absorption and release.
- Investment: trace asset additions and disposal settlement.
- Financing: separate debt, equity and distributions.
- Other cash effects: explain FX, restriction and classification.
- Reconciliation: prove movement and investigate residuals.
- Business explanation: distinguish recurring, intentional, deteriorating and exceptional movements.
- Decision: assign action, funding response, investigation and ownership.
Use Profit effect → Balance Sheet movement → Cash effect → Cause → Sustainability → Decision. Receivables rose 42% and inventory 35%, against revenue growth of 11.11% and comparable operating-cost growth of 11.15%. Their 3.5 cash absorption is established; scale alone does not explain the higher endpoint intensity. Collection deterioration and excess stock remain hypotheses until ageing, demand and purchasing evidence support them.
The finding records the observed balances, deterministic adjustment, operating category, source evidence, recurrence, proposed cause, liquidity consequence, uncertainty, action and owner. Credit control should reconcile ageing and subsequent receipts; operations should test stock requirements and convertibility. Treasury should incorporate their evidenced timing before increasing borrowing. The controller owns the cash bridge and confirms that corrective actions have not merely shifted balances across the reporting date.
Capex may be intentional investment, but its maintenance and expansion split needs the asset plan. Drawings provide funding, not recurring operating generation. Dividends are discretionary only within actual obligations and approvals. Management should test distribution and investment capacity against forecast cash, repayment dates and minimum liquidity rather than treating unchanged cash as proof that the current policy is sustainable.
Separate historical explanation from cash sensitivity
If the additional 2.1 receivable balance had been collected within the year, with every other flow unchanged, closing cash would be 4.6. That calculation measures sensitivity, not an available release promise: contractual terms, disputes and customer capacity may prevent collection. Equally, avoiding a 1.0 dividend would preserve 1.0 cash only if the distribution had not already become an unavoidable obligation. Keep these conditional decisions outside the historical reconciliation.
Reject explanations that only look complete
| Failure | Why it looks correct | Why it fails | Required control |
|---|---|---|---|
| Profit equals cash; EBITDA plus depreciation | Familiar earnings measures | Timing omitted; expense reversed twice | Declare starting basis |
| Mix before-tax and after-tax; deduct interest twice | Each adjustment is familiar | Recognition already included | Tax and interest bridges |
| Every balance change is cash; wrong signs | Endpoints subtract cleanly | Non-cash changes masquerade as settlement | Movement columns and account nature |
| Cash inside working capital | All current assets included | Cash is reconciled against itself | Explicit OWC perimeter |
| Debt reclassification equals borrowing | Current debt increased | Presentation is not funding | Total debt and gross flows |
| Net PPE equals capex; gain equals proceeds | Reported lines are available | Consumption and settlement differ | Asset roll-forward and receipts |
| Ignore leases and acquisitions | Closing statements balance | Non-cash or acquired balances distort flows | Separate inception and scope movements |
| Provisions permanently non-cash; impairment reversal alone | Charges had no payment | Later settlement or disposal is missed | Liability and allowance schedules |
| Mixed periods; restated opening ignored | Arithmetic reconciles | Activity interval is false | Boundary gate before calculation |
| Ignore FX; interchange restricted and available cash | Bank totals look similar | Translation and availability disappear | Currency and cash-perimeter bridges |
| Residual in Other; narrative without reconciliation | Presentation appears finished | Missing evidence is hidden | Visible exception and investigation |
| Zero residual proves interpretation | Model balances | Economic causes remain untested | Source-backed drivers and owned decisions |
A traceable cash explanation is a controlled workflow
For Entimema Financial Intelligence, the workflow to specify is intake → interpret the P&L, Balance Sheets and schedules → extract source-linked values → harmonise entities, periods, units, currencies and signs → map the canonical financial structure → reconstruct operating, investing and financing movements → run deterministic roll-forwards → surface exceptions and residuals → request targeted review → produce a traceable cash explanation. This is a control architecture, not a claim that every movement can be recovered automatically from two statements.
Model intelligence may interpret documents, propose semantic mappings, identify likely non-cash items, detect ambiguity, suggest classifications and explain connected movements. Deterministic code owns arithmetic, cash signs, working-capital changes, roll-forwards, policy-defined tax and interest bridges, category subtotals, reconciliation and residuals. Humans approve material classifications, policy choices, recurrence, unresolved lease or acquisition treatment, estimates and the final liquidity conclusion.
Financial data normalisation makes inputs comparable; financial data validation establishes fixed controls; and the end-to-end workflow preserves evidence through review. The controlled month-end reporting workflow turns this reconstruction into a recurring cash reconciliation. Missing schedules should generate a bounded request for evidence and limit the affected conclusion, rather than produce a confident cash story.
The opening EUR 4.2m profit was neither lost nor available for unrestricted distribution. Operations generated cash, investment consumed almost all of it, and financing and translation completed the explanation. The next decision concerns the sustainability of that allocation. A cash-flow explanation is complete only when every material movement connects to evidence and the reconstructed change reconciles to cash.